Growth Hacking Course
Articles
Your ICP Is Probably Wrong (And Here's How to Actually Fix It)
By
February 1, 2026

Last updated: 2026-04-06
Everyone's got an ICP. It's usually sitting in a slide deck somewhere, last updated eighteen months ago, describing "mid-market SaaS companies with 50-500 employees."
Brilliant. That's only about 50,000 companies.
The problem isn't that companies don't have an Ideal Customer Profile. The problem is that most ICPs are gut feel dressed as analysis. Pattern recognition masquerading as rigour. Assumptions that have never been tested, baked into every downstream decision your go-to-market makes.
I recently completed a project that proved this in rather spectacular fashion. The client's most confident assumption about their best customers - the one that sales believed, marketing built messaging around, and leadership nodded along to - was statistically backwards. Not "no correlation." Actively reversed. Wrong direction entirely.
If they'd built their GTM strategy around that assumption, every downstream decision would have been wrong. Marketing would have targeted the wrong prospects. Sales would have prioritised the wrong deals. Budget would have flowed toward lower-value accounts.
The save? We tested the hypothesis statistically before baking it into the model. Data killed an expensive fiction.
This post is about how to do ICP properly. Not the "look at your top customers and pattern-match" version. The statistical, AI-enabled, actually-rigorous version that tells you what you need to know rather than what you want to hear.
The Two Traps Most Companies Fall Into
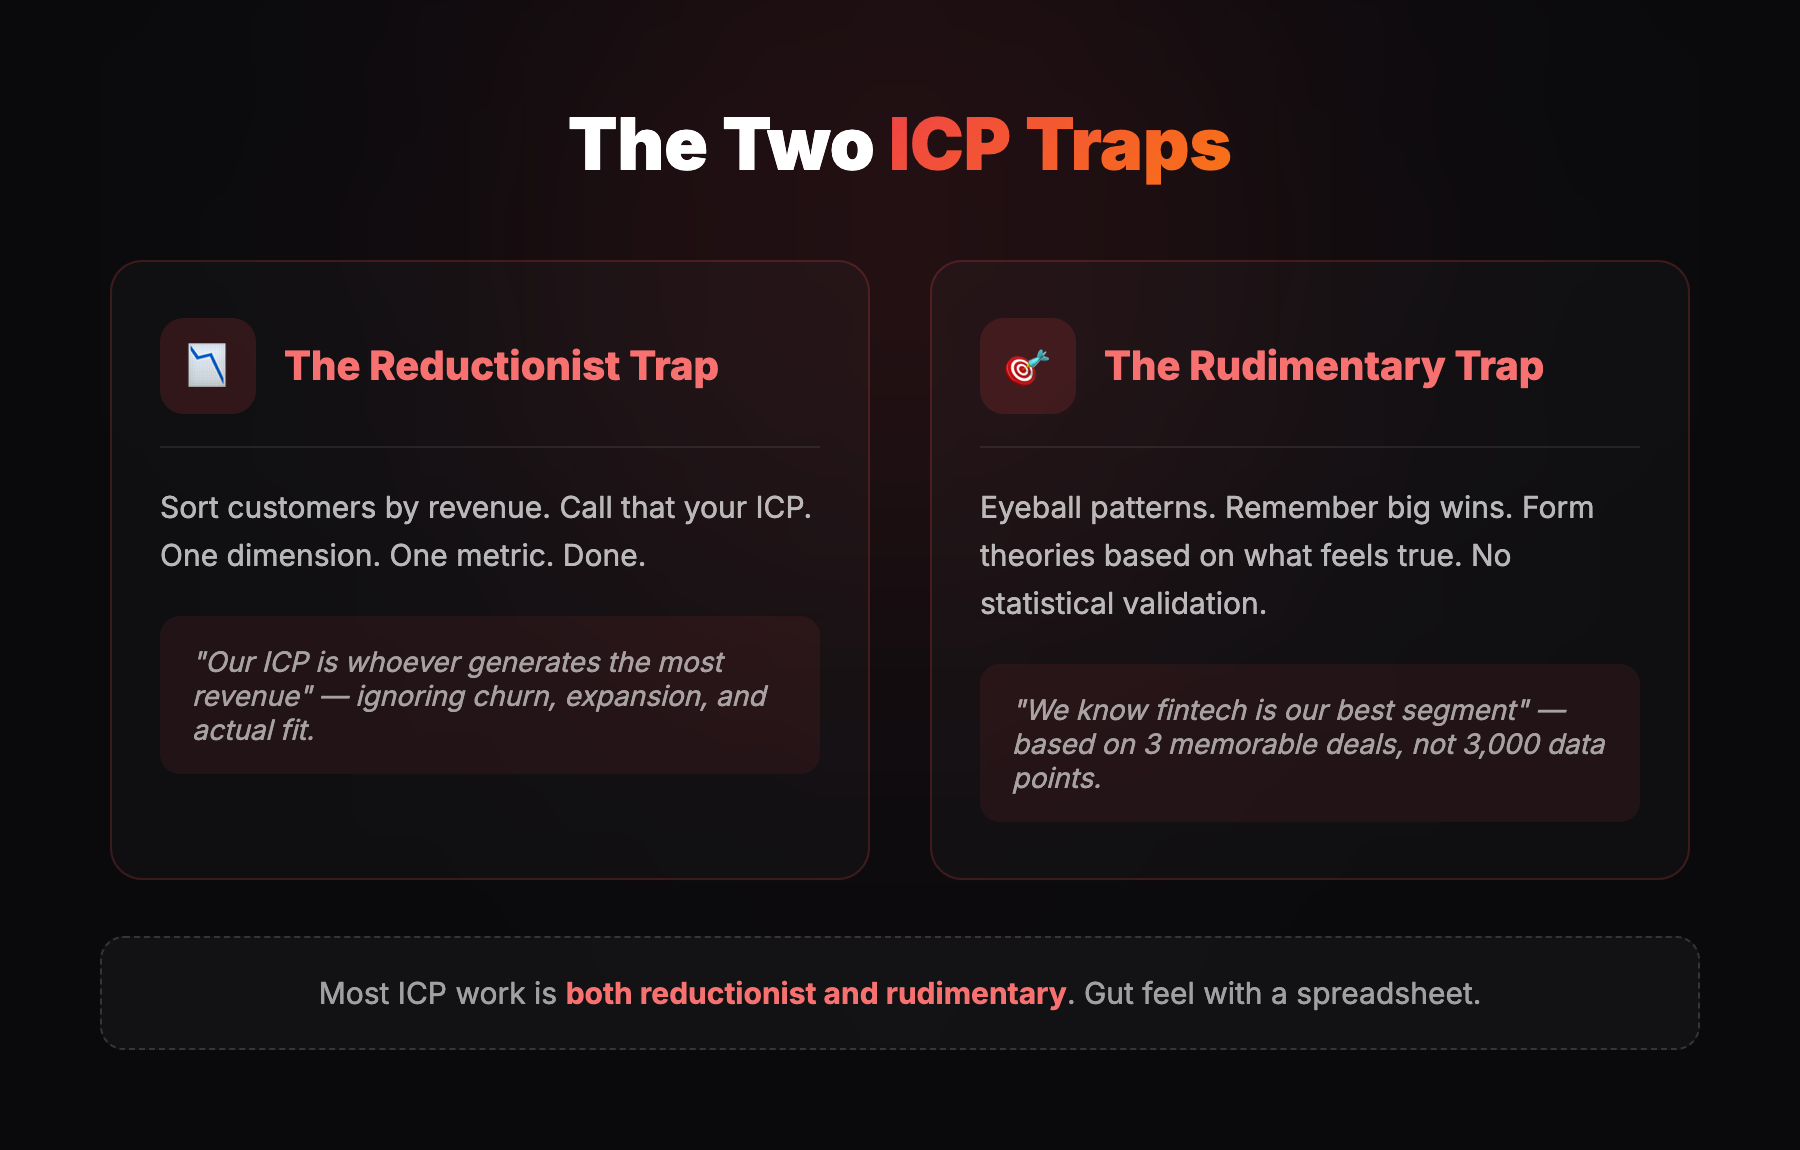
When companies build their ICP, they typically fall into two traps simultaneously.
The Reductionist Trap. They look at customers, sort by revenue, and say "that's our ICP because it generates the most money." One dimension. One metric. Done.
The problem? Revenue alone doesn't tell you about customer quality. A 500k contract that churns after eight months isn't better than a 200k contract that expands to 400k over three years. You're optimising for the wrong thing.
The Rudimentary Trap. They don't apply any statistical rigour. They eyeball patterns. They remember the big wins. They form theories based on what feels true.
The brain is a pattern-matching machine, but it's biased toward recent, vivid, and emotionally resonant examples. Your sales team remembers the fintech deal that closed in two weeks. They don't remember the fifteen fintech deals that went nowhere. Data doesn't have that bias.
Most ICP work is both reductionist and rudimentary. One variable (revenue), no validation (gut feel). Then companies wonder why their targeting isn't working.
The Methodology: Statistical Lookalike Modeling
The project I'm going to walk through used a completely different approach. Instead of pattern-matching demographics, we used regression-based statistical modeling to identify what actually predicts customer value.
This is how it works.
Step 1: Define the Outcome Variable
Before anything else, you need to define "value" unambiguously. Revenue? Lifetime value? Product usage? Expansion potential?
This matters more than you'd think. If you're optimising for initial contract value, you'll prioritise different customers than if you're optimising for lifetime value. If you're optimising for expansion potential, different again.
On this project, we used total monthly revenue - recurring revenue plus financial services revenue combined. One number. No ambiguity. Everyone agreed what "good" meant before we started looking for it.
Step 2: Gather and Enrich the Data
We started with roughly 2,800 customers and their internal data: revenue, product usage, engagement metrics, customer tenure, segment, geography.
Then we enriched it. This is where AI-native tooling starts to matter.
The enrichment added:
- Actual employee counts (replacing estimated data)
- Office count (single vs multi-location)
- Sales team size
- Industry classification
- Business type indicators
Before enrichment, 48.3% of employee counts were missing. After enrichment, 100% coverage. Before enrichment, 61.2% had industry data. After, 98.6%.
Data quality went from sketchy to comprehensive. That matters because you can't model what you can't measure.
Step 3: Run the Regression
This is the core of the methodology.
Instead of eyeballing which factors matter (which is what most companies do), you run a regression model with customer value as the outcome variable and all your signals as predictors.
The model outputs:
- Which factors actually predict value (and which don't)
- The coefficient weights - how much each factor contributes
- R-squared (model accuracy) - how much of the variance in customer value the model explains
On this project:
- R-squared = 74.3% - the model explained nearly three-quarters of the differences in customer value
- Cross-validation R-squared = 71.8% - no overfitting, the model generalises
- VIF check passed - no multicollinearity issues between predictors
The model told us exactly which factors matter and by how much. Not gut feel. Not intuition. Statistical weights derived from actual customer data.
Step 4: Validate Hypotheses Statistically
This is the step most companies skip entirely.
They have theories about what makes a good customer. They assume those theories are true. They never test them.
On this project, we tested four major hypotheses. Each one had to clear a statistical significance threshold of p<0.05. If a hypothesis didn't clear the bar, it didn't go in the model. Didn't matter how intuitive it seemed.
Hypothesis 1: Multi-location companies would have higher spend.
The logic: Coordination across offices requires more tooling and collaboration infrastructure.
Result: +28.4% higher overall spend. Statistical significance: p=0.024. Effect size: Cohen's d = 0.084 (small but real).
Verdict: Validated. Multiple offices means more complexity, more users, more need for centralised tools.
Hypothesis 2: Sales team size would predict higher spend.
Result: Top 25% by sales team size spent 118.2% more than bottom 25%.
But: Linear correlation was weak - confounded by company size.
Verdict: Partial validation. Use as secondary indicator, not primary.
Hypothesis 3: High-growth, VC-backed companies would generate higher value than established, bootstrapped companies.
This was the big one. The assumption everyone believed.
Expected: Higher spend. Rapidly scaling companies are hiring fast, expanding teams, adopting new tools constantly. More growth equals more spend equals more value.
Actual: 23.8% lower spend. p<0.001.
This wasn't noise. This wasn't edge cases. This was a real, validated reversal. The assumption was completely backwards.
More on this in a moment, because it's the most important finding from the entire project.
Hypothesis 4: Company age would correlate with revenue.
Result: No meaningful correlation. r=0.021, p=0.29.
There was a slight sweet spot at 6-10 years, but the difference was negligible.
Verdict: Not predictive. Don't use company age as a filter.
Step 5: Build the Scoring Engine
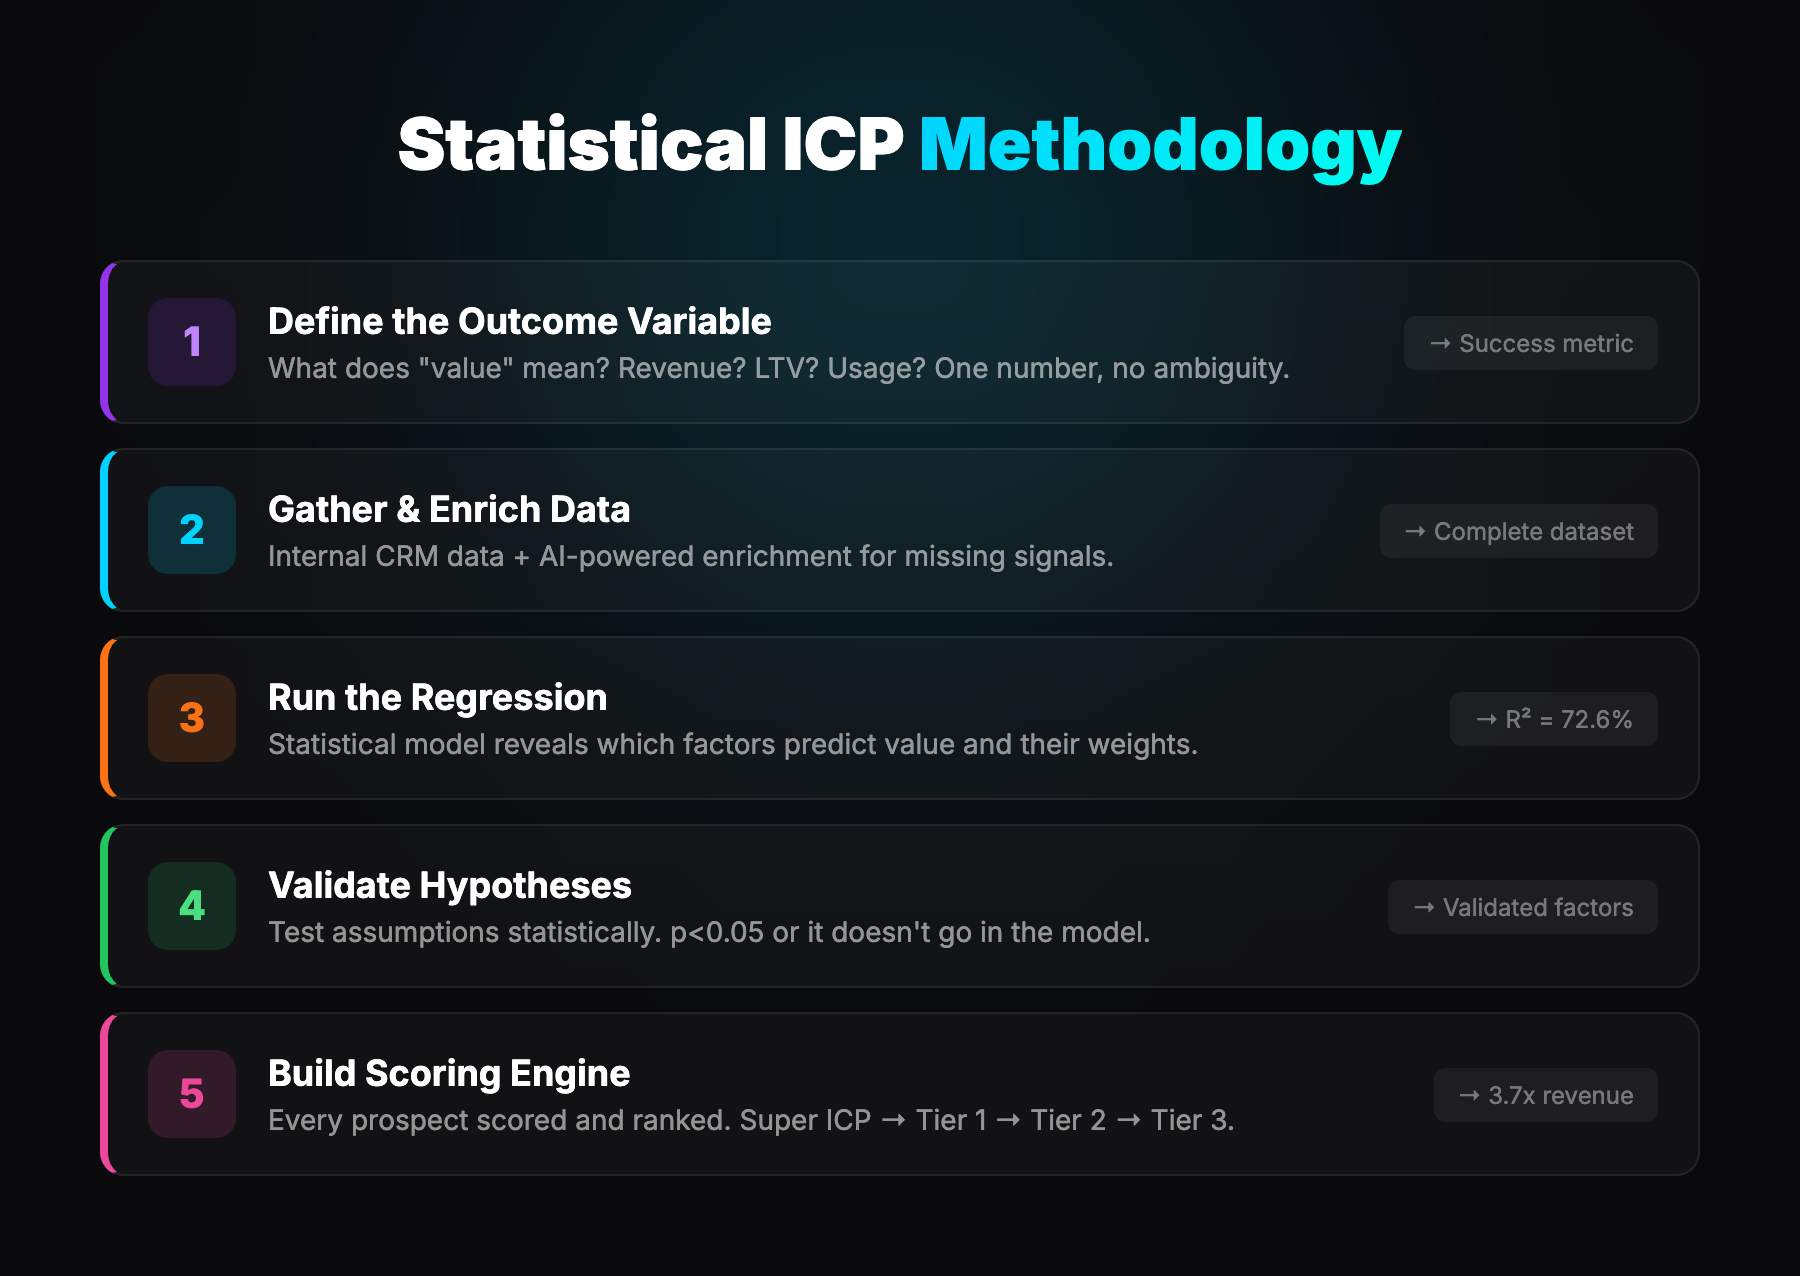
With the validated predictors and their weights, we built a scoring model. Every prospect gets a score based on the weighted factors. Stack-rank your target accounts. Prioritise accordingly.
The output was approximately 820 priority accounts across four segments:
- Segment 1 (top 5%): Highest predicted value
- Segment 2: Strong predicted value
- Segment 3: Moderate predicted value
- Segment 4: Lower predicted value
The Segment 1 accounts generated 4.2x more revenue than the average customer.
That's what statistical ICP modeling gives you. Not vague segments. Specific, ranked accounts with predicted value attached.
The Assumption Reversal: When Everyone Is Wrong
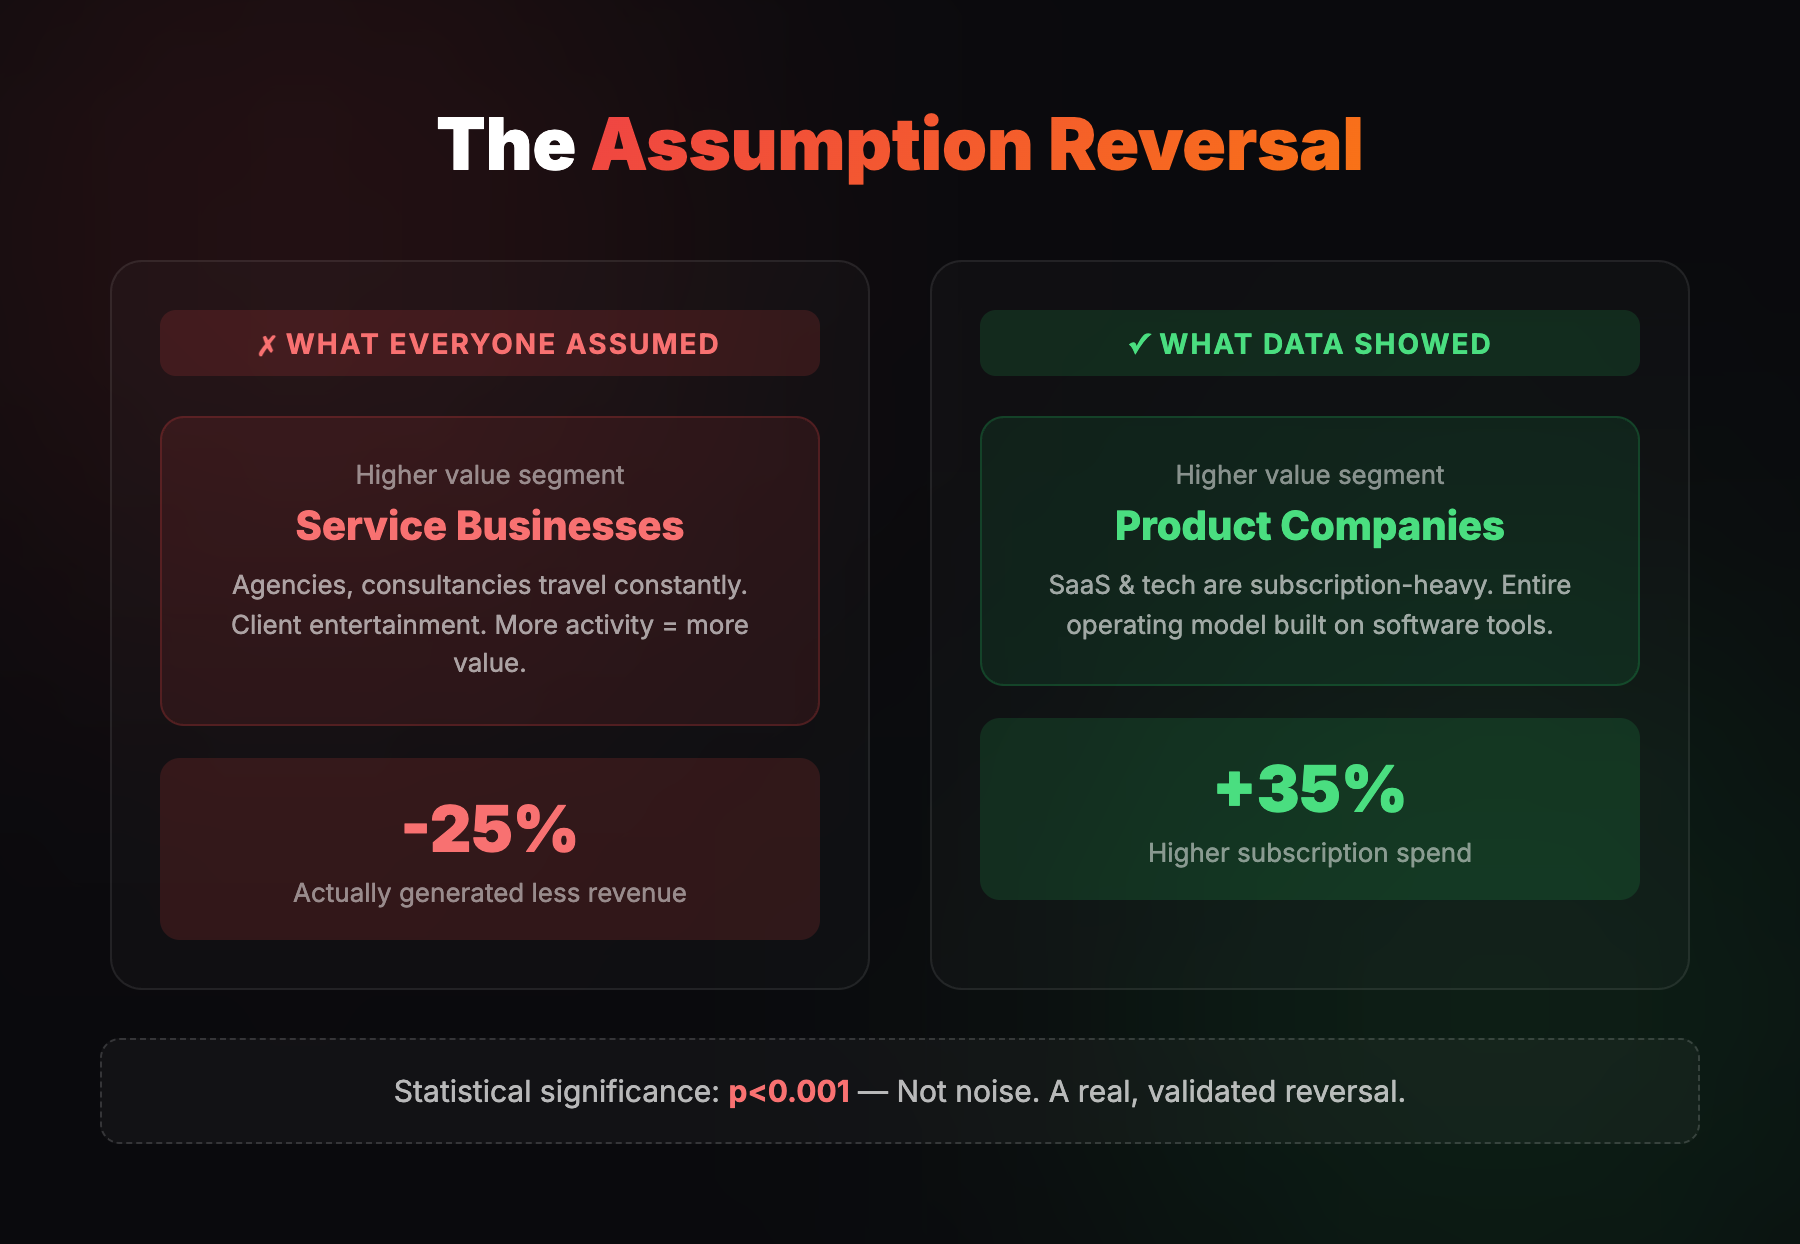
I want to spend more time on Hypothesis 3 because it illustrates exactly why statistical validation matters.
The assumption: High-growth, VC-backed companies - the ones scaling rapidly, hiring aggressively, expanding into new markets - would be higher spenders. They're growing fast. They're adopting new tools constantly. They have fresh funding to spend. More growth, more spend.
This made intuitive sense to everyone. Sales believed it. Marketing built messaging around it. Leadership nodded along.
The data: High-growth, VC-backed companies spent 24% less than established, bootstrapped companies.
The statistical significance was overwhelming. p<0.001. This wasn't a marginal difference. This was a fundamental reversal of the core assumption driving go-to-market strategy.
Why it makes sense in hindsight:
High-growth companies are often chaotic. They're moving fast, but that means constant tool churn - adopting something, abandoning it six months later for the next shiny thing. They're cost-conscious despite the funding headlines. Every pound is scrutinised against runway.
Established, bootstrapped companies are different. They've been profitable for years. They have predictable budgets. When they adopt a tool, they stick with it. They expand usage methodically. They don't churn because switching costs matter to them.
The numbers:
- High-growth companies: 32% lower lifetime value than established companies
- Established companies: Higher retention, more expansion, larger total contracts
- The gap was statistically overwhelming (p<0.001)
The GTM implication:
The messaging was backwards. Instead of chasing the latest YC batch with "scale your operations," the better play was targeting established mid-market companies with "consolidate and optimise what you already have."
Same product. Completely different positioning. Data revealed it.
If we hadn't tested this hypothesis statistically, every downstream decision would have been wrong. Marketing would have targeted the wrong prospects. Sales would have prioritised the wrong deals. Messaging would have resonated with the wrong people. Budget would have flowed toward lower-value accounts.
This is why statistical validation matters. Not because data is always right and humans are always wrong. But because confident assumptions are exactly the ones most likely to go untested. And when they're wrong, they're catastrophically wrong.
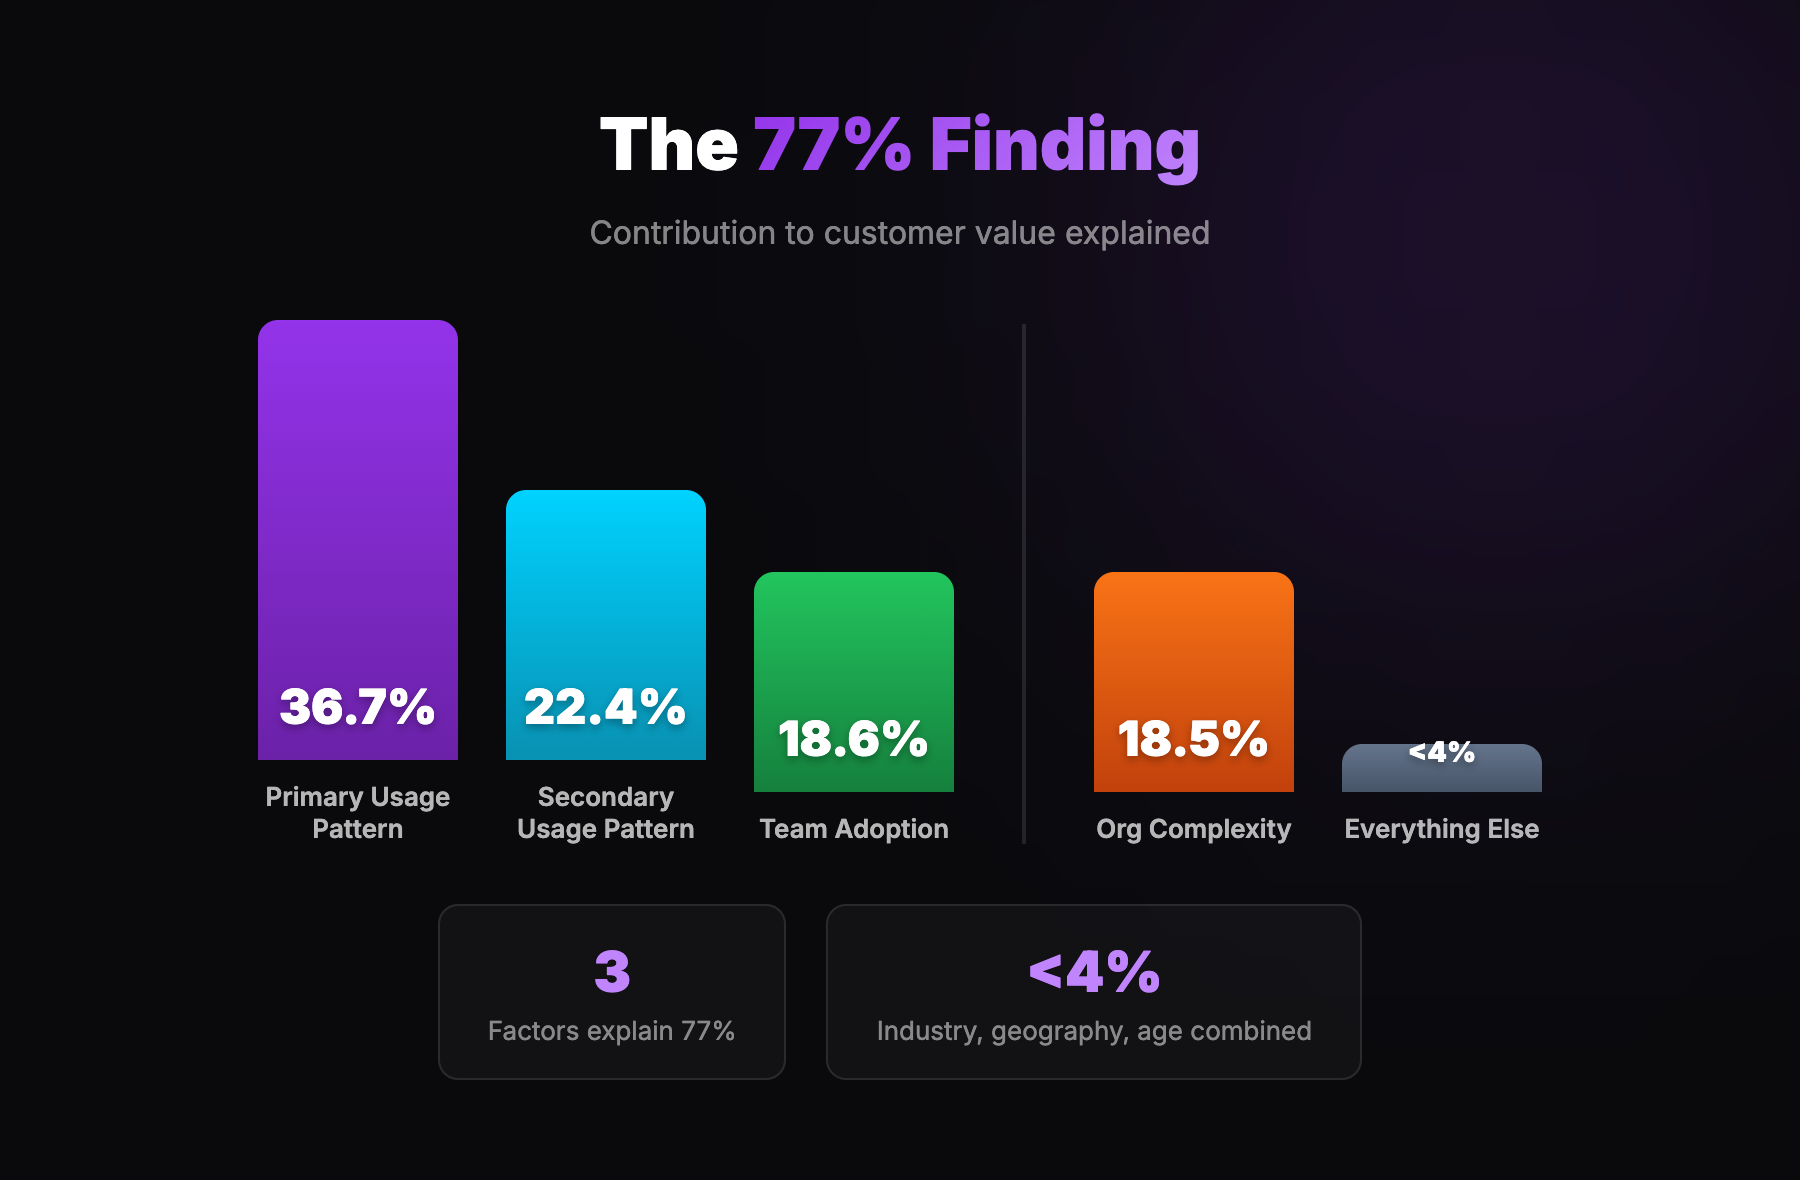
The 78% Finding: Simplicity Wins
Another finding that surprised everyone.
We started with dozens of potential signals. Industry. Geography. Company size. Tech stack. Funding stage. Growth rate. Office count. Sales team size. Employee count. Tenure. Engagement metrics. Adoption scores.
After running the regression, three factors explained 78% of customer value:
- Primary product usage pattern (38.2%) - how they used the core product functionality
- Secondary product usage pattern (21.8%) - a different usage behaviour that correlated with value
- Team adoption (17.4%) - how many people in the organisation actively used the platform
A fourth factor - organisational complexity (multiple entities, subsidiaries) - added another 19.1%.
Everything else - industry, geography, company age, funding stage, growth rate, engagement scores - contributed less than 4% combined.
Let that sink in. All those firmographic signals that companies obsess over? Industry vertical? Geographic region? Company age? Funding stage? Growth rate?
Combined, they explained less than 4% of the variance in customer value.
The implication:
Most companies overcomplicate ICP. They use dozens of criteria when 3-4 actually matter. The rest is noise that makes targeting harder, not better.
Every additional criterion you add to your ICP filter reduces your addressable market. If those criteria don't actually predict value, you're not getting more precise - you're just getting smaller. You're excluding good prospects for no reason.
The pattern:
Notice that the top predictors are all behavioural - how customers use the product. The demographic signals (industry, size, geography) barely moved the needle.
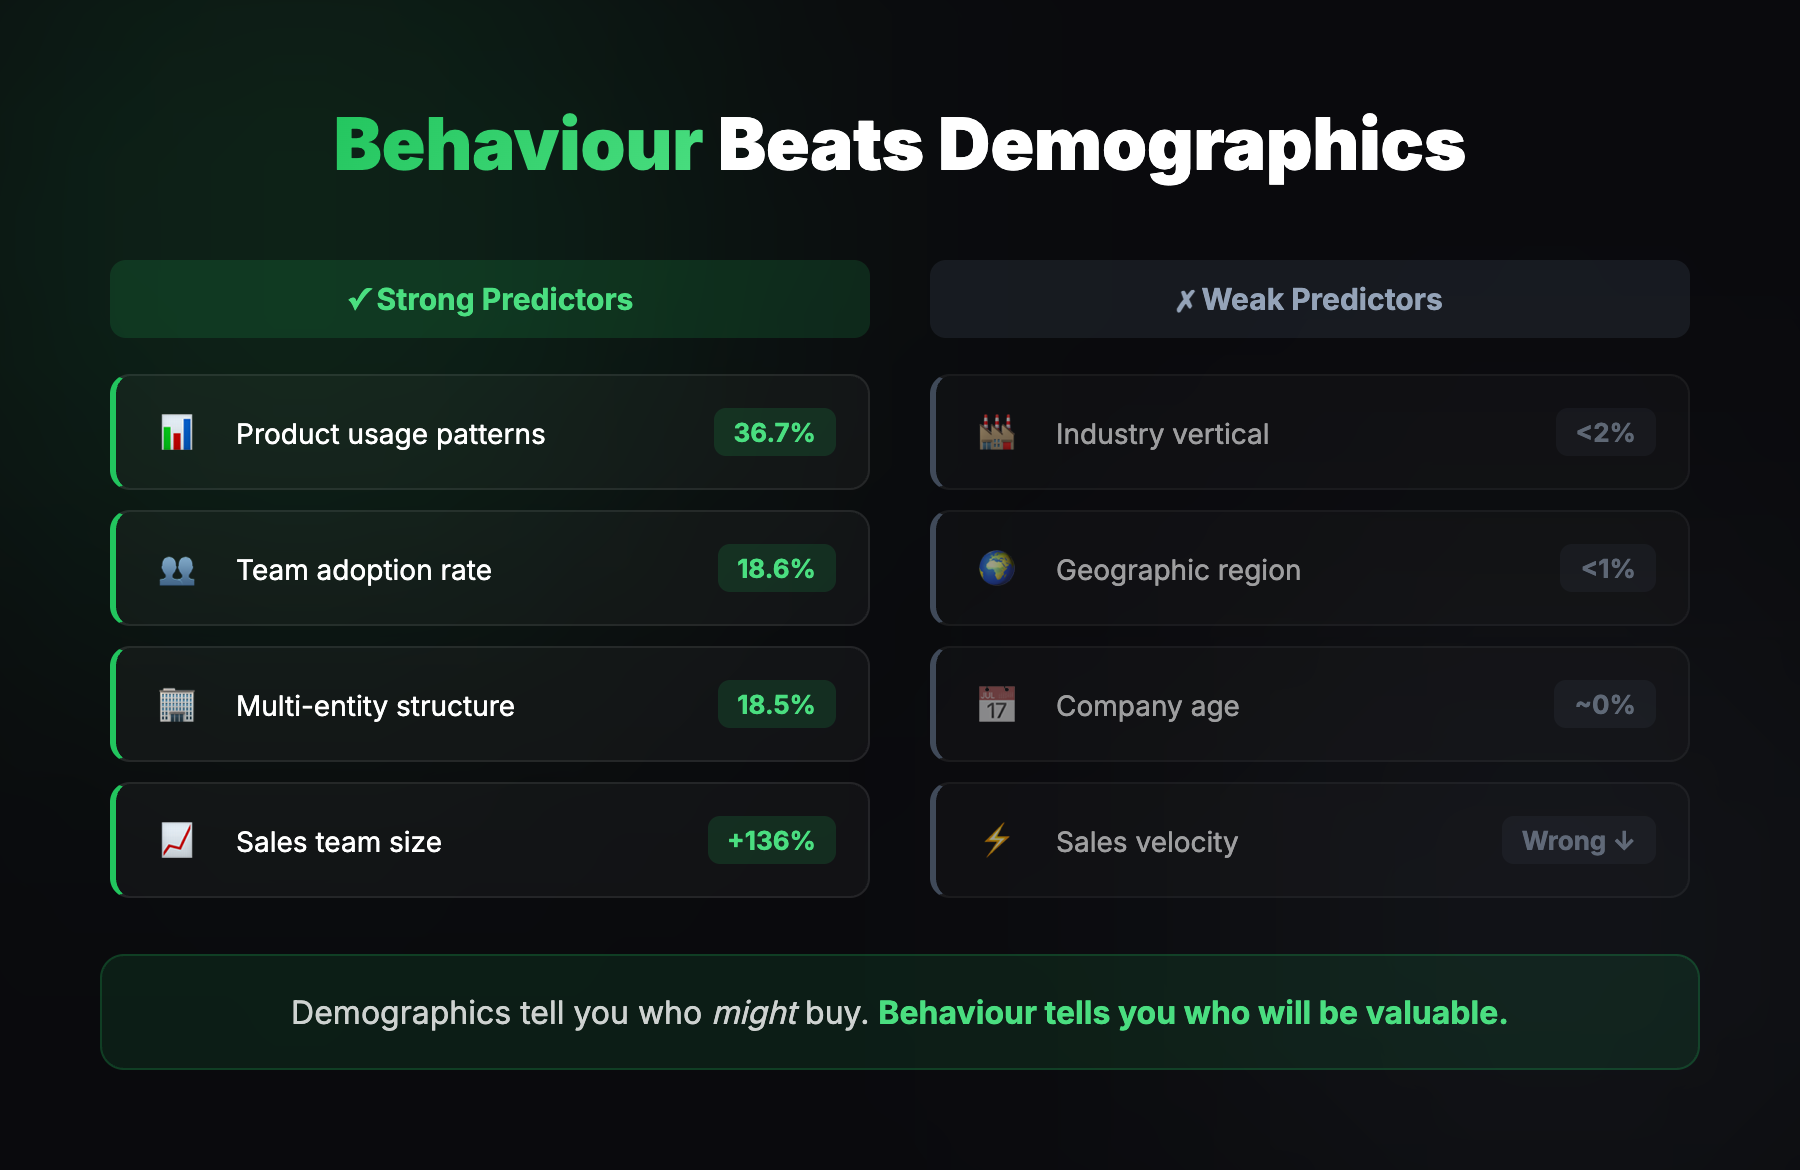
Demographics tell you who might buy. Behaviour tells you who will be valuable.
This is a fundamental shift in how to think about ICP. The question isn't "what do our best customers look like?" The question is "what do our best customers do?"
What Actually Predicts Value (And What Doesn't)
Let me break down the specific findings in more detail.
Strong Predictors (Statistically Validated)
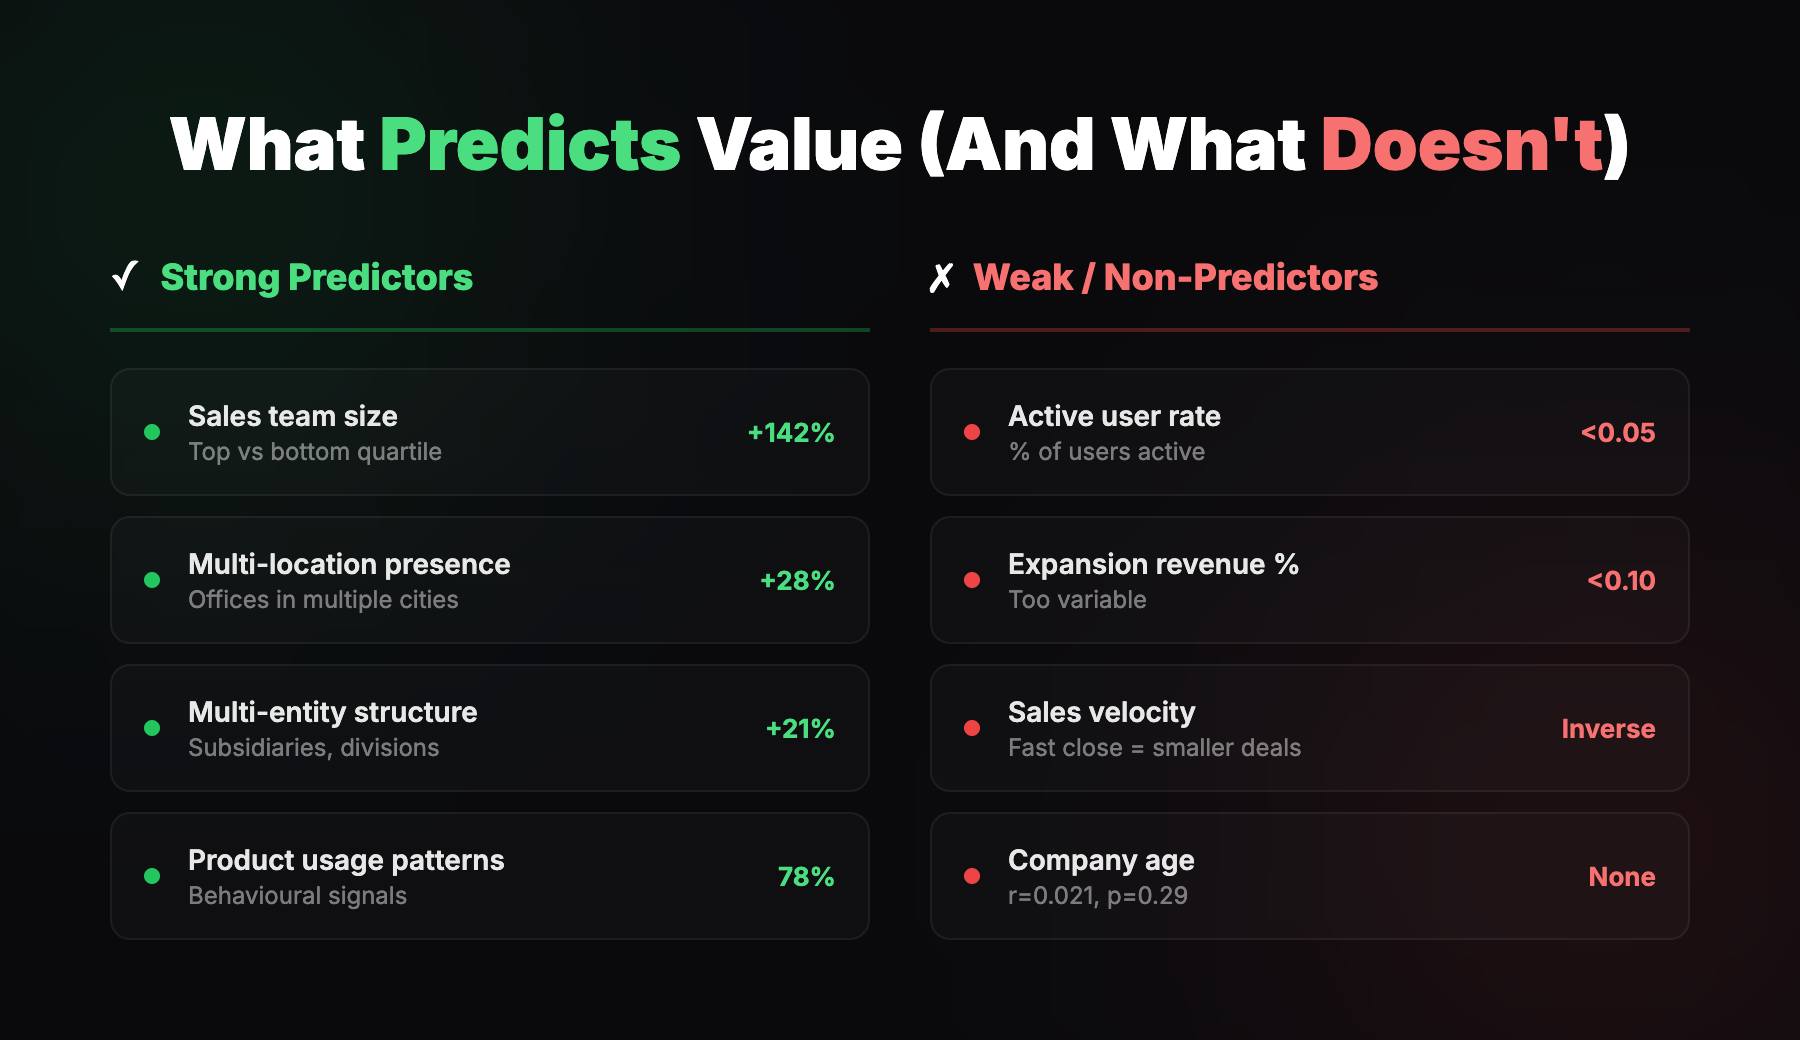
Sales team size.
The strongest single enrichment predictor we found. Companies with large sales teams (top quartile) spent 142% more than those with small sales teams (bottom quartile). This held across all spending categories.
Why? Large sales teams mean more tools, more processes, more activity. And sales team size correlates with growth stage and ambition. A company investing heavily in sales is a company investing heavily in growth.
Multi-location presence.
Specifically predicts higher overall spend (+28%, p=0.024). If you've got offices in London, Berlin, and Paris, you need tools that work across all of them.
Strong predictor of both spend and retention - useful for targeting and messaging.
Multi-entity structure.
Customers with multiple business entities (subsidiaries, divisions) generated 21% higher recurring revenue. Complexity equals value. More entities mean more users, more seats, more need for centralised control.
Product usage patterns.
How customers actually use the product was far more predictive than any demographic signal. Heavy users of certain features correlated strongly with total value. Light users, regardless of company size or industry, were lower value.
Weak or Non-Predictors (Statistically Tested, Failed)
Active user rate.
Weak correlation (<0.05). What matters is absolute number of active users, not the percentage. A company with 100 active users out of 200 is better than 10 out of 10.
Expansion revenue percentage.
Correlation <0.10. Too variable - depends on upsell timing, not inherent customer quality.
Product adoption score.
Correlation 0.092. Engagement metric, doesn't scale with revenue.
Time to close (sales velocity).
This one's counterintuitive. Faster deals correlated with smaller customers. Smaller companies close faster but generate less revenue. Larger companies take longer but are worth 3x more.
If you're optimising for sales velocity, you're probably optimising for the wrong segment.
Company age.
r=0.021, p=0.29. Not predictive at all. Stop using company age as a filter.
Geographic Differences: Why One Global ICP Is Probably Wrong
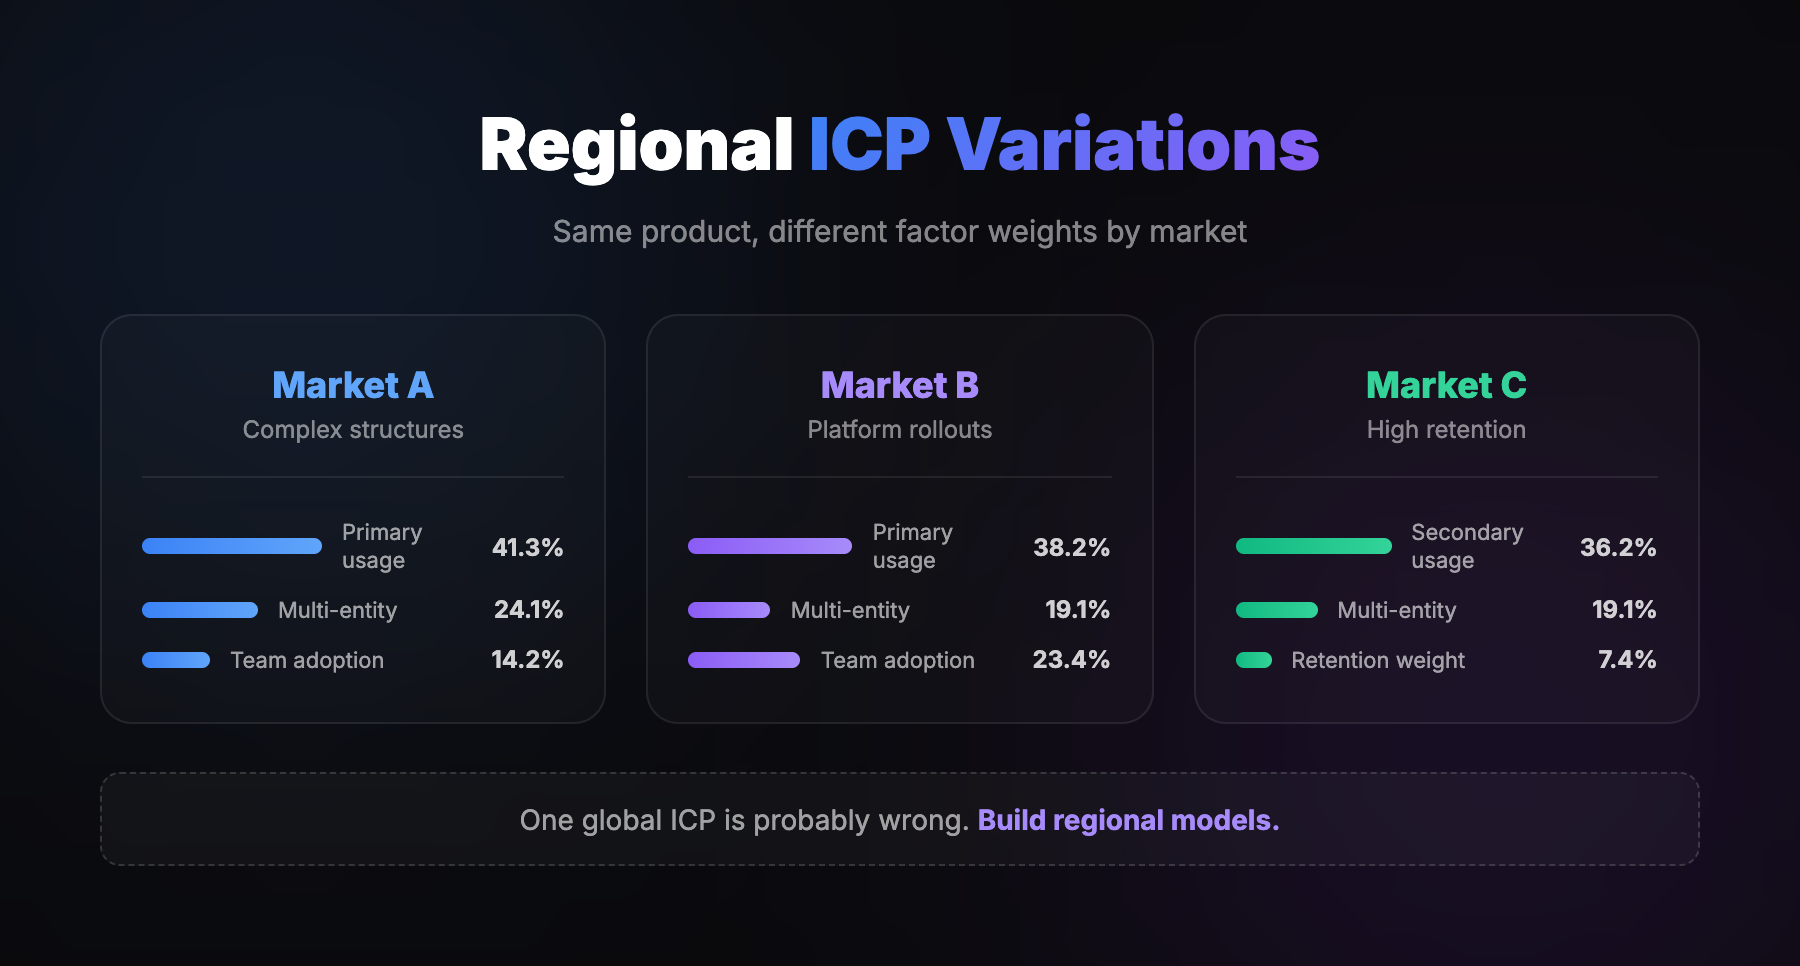
The project built separate models for three European markets. The factor weightings were meaningfully different.
Market A (France-equivalent):
- Over-indexed on multi-entity complexity (24.1% weight vs 19.1% global)
- Over-indexed on subscription behaviour (41.3% vs 38.2% global)
- Under-indexed on team adoption (14.2% vs 17.4% global)
- Profile: Complex organisational structures, centralised control
Market B (Germany-equivalent):
- Highest weight on team adoption (23.4% vs 17.4% global)
- Highest average customer value per tier
- Profile: Companies that roll out platform-wide, high user counts
Market C (UK-equivalent):
- Dramatically over-indexed on a specific spending category (36.2% vs 21.8% global - 66% above average)
- Retention mattered more (7.4% weight on customer lifetime vs 2.1% global)
- Profile: Larger companies, specific spending patterns
The implication:
Running one global ICP is probably wrong. If your best customers in different markets have different characteristics, your targeting should reflect that.
Most companies don't bother with regional ICP variations. They build one model and apply it everywhere. The ones that do have an advantage.
This doesn't mean you need completely different ICPs for every country. But if you're operating across markets with meaningfully different business cultures (France vs Germany vs UK, for example), it's worth checking whether your ICP weights hold.
The Mid-Market Sweet Spot

The data showed the highest concentration of top-tier customers wasn't in the largest company segment or the smallest. It was in the middle.
The largest companies had:
- Longer sales cycles
- More stakeholders
- Higher switching costs (harder to land)
- Slower expansion
The smallest companies had:
- Higher churn risk
- Limited expansion potential
- Lower absolute value
The middle tier had:
- Enough budget and complexity to matter
- Fast enough to move
- Room to expand
62% of the highest-value customers came from this mid-market segment. Not enterprise. Not SMB. The middle.
This is another assumption worth testing in your own data. Most companies assume bigger is better. Sometimes it is. Sometimes mid-market is the sweet spot. Sometimes it's a specific niche within a size band.
The point is you should know from data, not assume from convention.
How AI Actually Enables This
Now let's talk about why this approach is newly possible.
Traditional ICP work was constrained by data availability. You could only analyse signals that were already in your CRM or available in commercial databases. If you wanted to know whether your customers run events, attend conferences, have specific technologies, or exhibit particular behaviours - you had to research that manually. At scale, that was prohibitively expensive.
AI changes the economics of data collection.
Automated Enrichment at Scale
On this project, we needed to test a hypothesis: "Companies that run or attend a lot of events are better customers."
One of the team believed this strongly. It made intuitive sense.
To test it, we needed to know which of our 2,800 customers were events-heavy. That data wasn't in the CRM. It wasn't in any commercial database.
We used AI agents to check each company's website. Look for events pages. Conference mentions. Trade show participation. Webinar hosting.
Doing that manually would have cost thousands of pounds in research hours. With AI agents, it cost almost nothing.
And the finding? Events-based companies - companies that either attend a lot of events or run a lot of events - were not actually good fit. Another assumption killed by data.
Custom Signal Collection
This is the key innovation. You're not limited to data that's already in your CRM or available in databases. You can go collect custom behavioural and firmographic signals that are specific to your business and actually matter for your model.
Want to know if prospects have a specific technology? AI can check.
Want to know if they're hiring for certain roles? AI can check.
Want to know if their website mentions certain problems? AI can check.
Previously impossible data collection is now economically viable. So you can test hypotheses that would have been too expensive to validate.
Speed of Analysis
The entire analysis - data cleaning, enrichment integration, correlation analysis, hypothesis testing, model building, tier assignment - was completed in days, not months.
Traditional consulting engagements for this kind of work take 8-12 weeks. With modern tooling, you can iterate much faster.
That matters because ICP isn't a one-time exercise. Markets shift. Products evolve. Customer bases change. The ability to re-run your analysis quickly means you can update your ICP when it actually matters strategically - new product launch, new market entry, post-acquisition integration - rather than waiting for the next annual planning cycle.
What AI Doesn't Do
To be clear: AI doesn't replace statistical rigour. It enables it.
LLMs are great for pattern recognition in text. They're not great for quantitative analysis. They hallucinate correlations. They can't tell you if a relationship is statistically significant. They don't output p-values or effect sizes.
This project required statistical rigour. Proper regression analysis. Significance testing. Cross-validation. No hallucinations.
AI's role was data collection and enrichment. The analysis was statistical, not generative.
What Traditional ICP Misses
Let me summarise the failure modes of traditional ICP work, because understanding what's broken is the first step to fixing it.
Survivorship bias.
You only look at customers who converted. You don't see the high-potential prospects who never closed. You can't learn from what you're missing.
If your best customers happen to be in fintech, you'll conclude fintech is your ICP. But maybe there were fifty fintech prospects who never converted because your messaging was wrong. You'll never know.
Correlation vs causation.
Your best customers might cluster in fintech. But is fintech the cause of their value, or is there something else those companies share that fintech happens to correlate with?
Maybe fintech companies have larger sales teams. Maybe they're more likely to be multi-entity. Maybe they have specific usage patterns. Fintech is the demographic proxy. Something else is the actual driver.
Single-variable thinking.
"Our ICP is mid-market tech companies."
That's one variable. Customer value is almost never explained by one thing. You need the combination of factors and their relative weights.
Gut feel dressed as analysis.
"We know our best customers are..."
Do you? Or is that the pattern your brain noticed because it's memorable?
The brain is biased toward recent, vivid, and emotionally resonant examples. The 500k fintech deal that closed last quarter is more memorable than the fifty 50k deals that churned. But those fifty churned deals might tell you more about ICP than the one big win.
Confirmation bias in hypothesis testing.
Companies form hypotheses, then look for evidence that supports them. They don't set significance thresholds in advance. They don't run proper statistical tests. They find what they expect to find.
The high-growth assumption would have survived confirmation bias easily. "See, that Series B company adopted us immediately. That proves our hypothesis." It took statistical testing to reveal that fast adoption didn't translate to long-term value.
Operationalising the Model
Building a statistical ICP model is only useful if the organisation actually uses it. This is how the operationalisation worked on this project.
For Sales: Tiered Account Lists
Sales received a segmented account list - Segment 1, Segment 2, Segment 3, Segment 4 - allocated to different reps depending on their experience level.
Segment 1 accounts get senior reps. Segment 4 accounts get the newer folks. Resources flow toward predicted value.
But the bigger shift was conceptual. The client's sales team had historically segmented customers by size. SMB, mid-market, enterprise. The usual.
The data showed that size is not a strong correlation with ICP. It's not linear. Some small companies are high-value. Some large companies are low-value.
We needed to change their paradigm for how they think about customers. Shift away from size segments toward value tiers.
The data was compelling enough that it overcame organisational inertia. When the statistical evidence clearly shows your assumptions are wrong, it's hard to argue with it.
For Marketing: Targeted Messaging
Different value props for different customer types.
The assumption reversal meant the primary messaging angle was backwards. "Scale fast with us" resonated with the wrong audience (high-growth companies who'd churn). "Consolidate and optimise" resonated with the right audience (established companies who'd expand).
Marketing budget allocation shifted too. Invest in channels and segments that reach predicted-high-value accounts. Stop spreading budget equally across segments with different predicted values.
For Customer Success: Proactive Tiering
Customer success used the tiering for prioritisation. High-value customers get more proactive outreach, more check-ins, more attention.
But again, the paradigm shift mattered more than the mechanics. CS teams typically segment by contract size. "Our enterprise customers get white-glove treatment."
If contract size doesn't correlate with actual value (which it often doesn't - see the speed-to-close finding), you're over-investing in some customers and under-investing in others.
Setting Expectations
One underrated benefit: knowing what a customer is likely worth before closing them.
If your model predicts a prospect is Segment 4, you know the expected value. You can set realistic deal size expectations. You can decide how much sales resource to invest. You can avoid over-investing in accounts with low predicted value.
This reduces surprises downstream. No more "why did that big logo churn after six months?" Because you knew from the start they weren't actually high-fit, just high-profile.
The Lookalike Problem (And How to Solve It)
Once you have a statistical ICP model, the natural next step is finding more companies that match. Lookalike modeling.
Most companies approach this by going to a lookalike vendor - Ocean.io, Apollo, ZoomInfo, whatever - and saying "find me companies that look like my best customers."
On this project, we found a better approach.
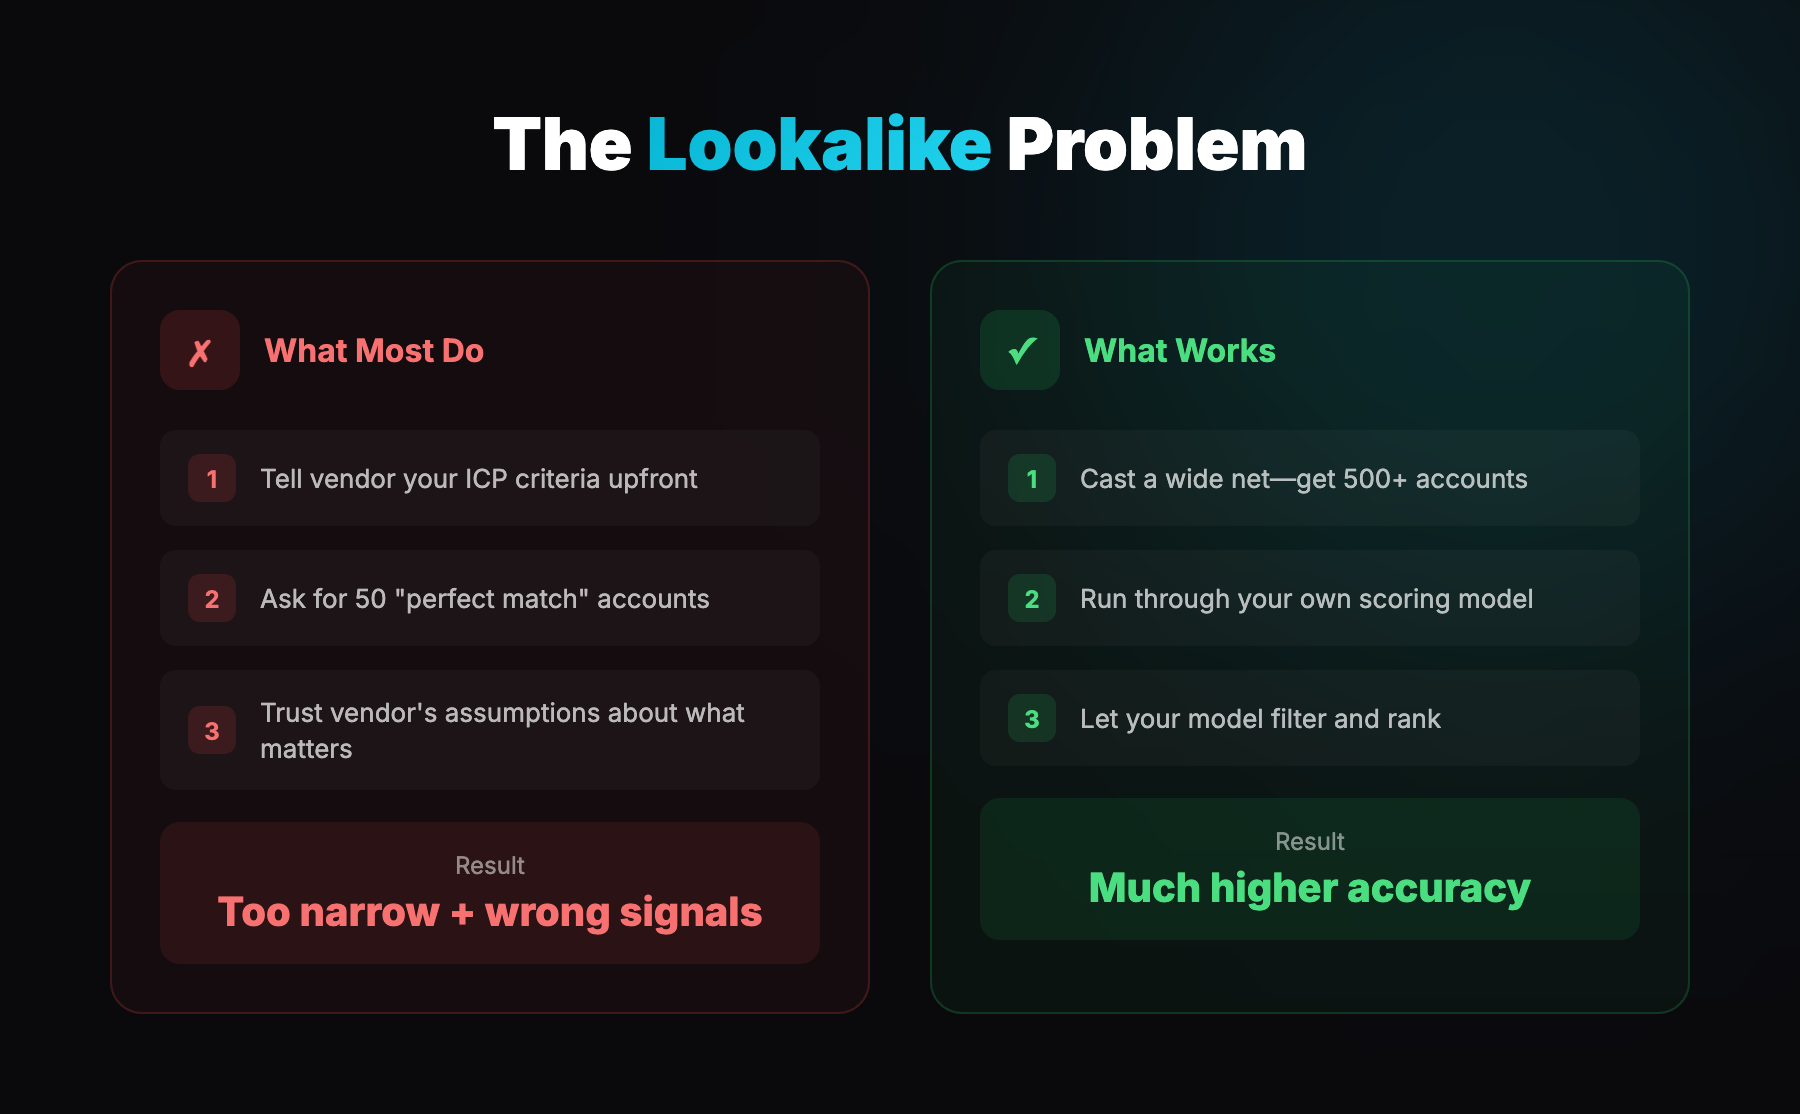
Instead of asking the lookalike vendor to find companies that match our ICP characteristics upfront, we cast a wider net. We got a broad list of companies from multiple sources. Then we ran everything through our own prioritisation engine to score and rank them.
The result: much higher accuracy.
The lookalike vendors were both too narrow in what they surfaced and wrong about what actually mattered. They were making assumptions about which variables predict value. Our statistical model knew better.
The insight:
Don't trust external tools to understand your ICP nuances. Use them as dumb pipes to get volume. Then apply your own intelligence to separate signal from noise.
Most companies do the opposite. They try to get the vendor to be smart upfront and give them a perfect list of fifty accounts. They should be getting five hundred accounts and letting their own model do the filtering.
What This Changes About GTM
Let me summarise the operational shifts that come from doing ICP this way.
Targeting shifts from demographic to behavioural.
Instead of "mid-market tech companies," you're targeting "companies exhibiting X, Y, Z patterns." Demographics are proxies. Behaviour is the signal.
Messaging becomes segment-specific.
Different value props for different customer types. The assumption reversal meant completely different positioning for different audiences. Same product, different angle.
Sales prioritisation becomes data-driven.
Stack-ranked target account list based on predicted value. Segment 1 gets different treatment than Segment 4. Resources flow toward predicted returns.
Marketing budget allocation becomes predictive.
Invest in channels and segments that reach predicted-high-value accounts. Stop spreading budget equally across segments with different expected values.
Expectation setting becomes realistic.
Know what a customer is likely worth before closing them. Set deal size expectations accordingly. Don't over-invest in low-predicted-value accounts.
ICP becomes testable and updateable.
Because the methodology is statistical, you can re-run it when it matters. New product launch. New market entry. Strategic pivot. The ability to update your ICP quickly means it stays relevant.
The Bottom Line
Most ICP work is gut feel with a spreadsheet. It's pattern recognition dressed as analysis. Companies don't actually validate their assumptions statistically.
The biggest risk isn't not having an ICP - it's having one that's wrong. Wrong ICP equals wrong targeting equals wrong messaging equals budget burned on low-value prospects.
Assumptions need to be tested, not assumed. The most confident hypothesis on this project - "high-growth companies will be higher value because they're scaling fast" - was statistically reversed. Established companies were the high-value segment. If we hadn't tested it, every downstream decision would have been wrong.
Simplicity beats complexity. 78% of customer value was explained by 3 factors. Dozens of other signals contributed almost nothing. More criteria doesn't mean better targeting. It often means worse.
Behaviour beats demographics. How a company acts matters more than what a company looks like. Industry, size, geography are proxies. Behavioural signals are direct.
This can be done faster than you think. Modern tools - enrichment APIs, AI agents for data collection, statistical libraries - make data-driven ICP work accessible. It's not a six-month consulting engagement anymore.
The question isn't whether you have an ICP. The question is whether your ICP is actually right.
And unless you've tested it statistically, you probably don't know.
Frequently Asked Questions
What is statistical ICP modeling and how is it different from traditional ICP work?
Traditional ICP work is usually someone eyeballing their best customers and pattern-matching demographics. Statistical ICP modeling uses regression analysis to identify which factors actually predict customer value - with p-values and significance testing, not gut feel. On a recent project, this approach explained 74.3% of the variance in customer value and revealed that the client's most confident assumption was statistically backwards.
Why do most B2B SaaS companies get their ICP wrong?
Two traps, usually at the same time. The reductionist trap - sorting by revenue and calling it a day. And the rudimentary trap - no statistical validation whatsoever. Your brain remembers the big fintech deal that closed fast. It forgets the fifteen fintech deals that went nowhere. Data doesn't have that bias. Most companies build their ICP on pattern recognition that's never been tested.
Can AI replace the need for statistical rigour in ICP analysis?
Not even close. LLMs are brilliant for data collection and enrichment - checking company websites, classifying industries, gathering signals that would cost thousands to research manually. But they hallucinate correlations. They can't tell you if a relationship is statistically significant. AI enables rigour by making data collection cheap and fast. The actual analysis still needs proper regression, significance testing, and cross-validation.
How often should companies update their ICP?
ICP isn't a one-time exercise. Markets shift, products evolve, customer bases change. With modern tooling, you can re-run your analysis in days rather than months. I'd update it at every strategic inflection point - new product launch, new market entry, post-acquisition integration, major pivot. Waiting for the annual planning cycle means you're operating on stale assumptions for most of the year.
What matters more for ICP - firmographic data or behavioural signals?
Behavioural signals, and it's not even close. On the project I walked through, three behavioural factors (product usage patterns and team adoption) explained 78% of customer value. All the firmographic signals combined - industry, geography, company age, funding stage, growth rate - explained less than 4%. Demographics tell you who might buy. Behaviour tells you who will actually be valuable.